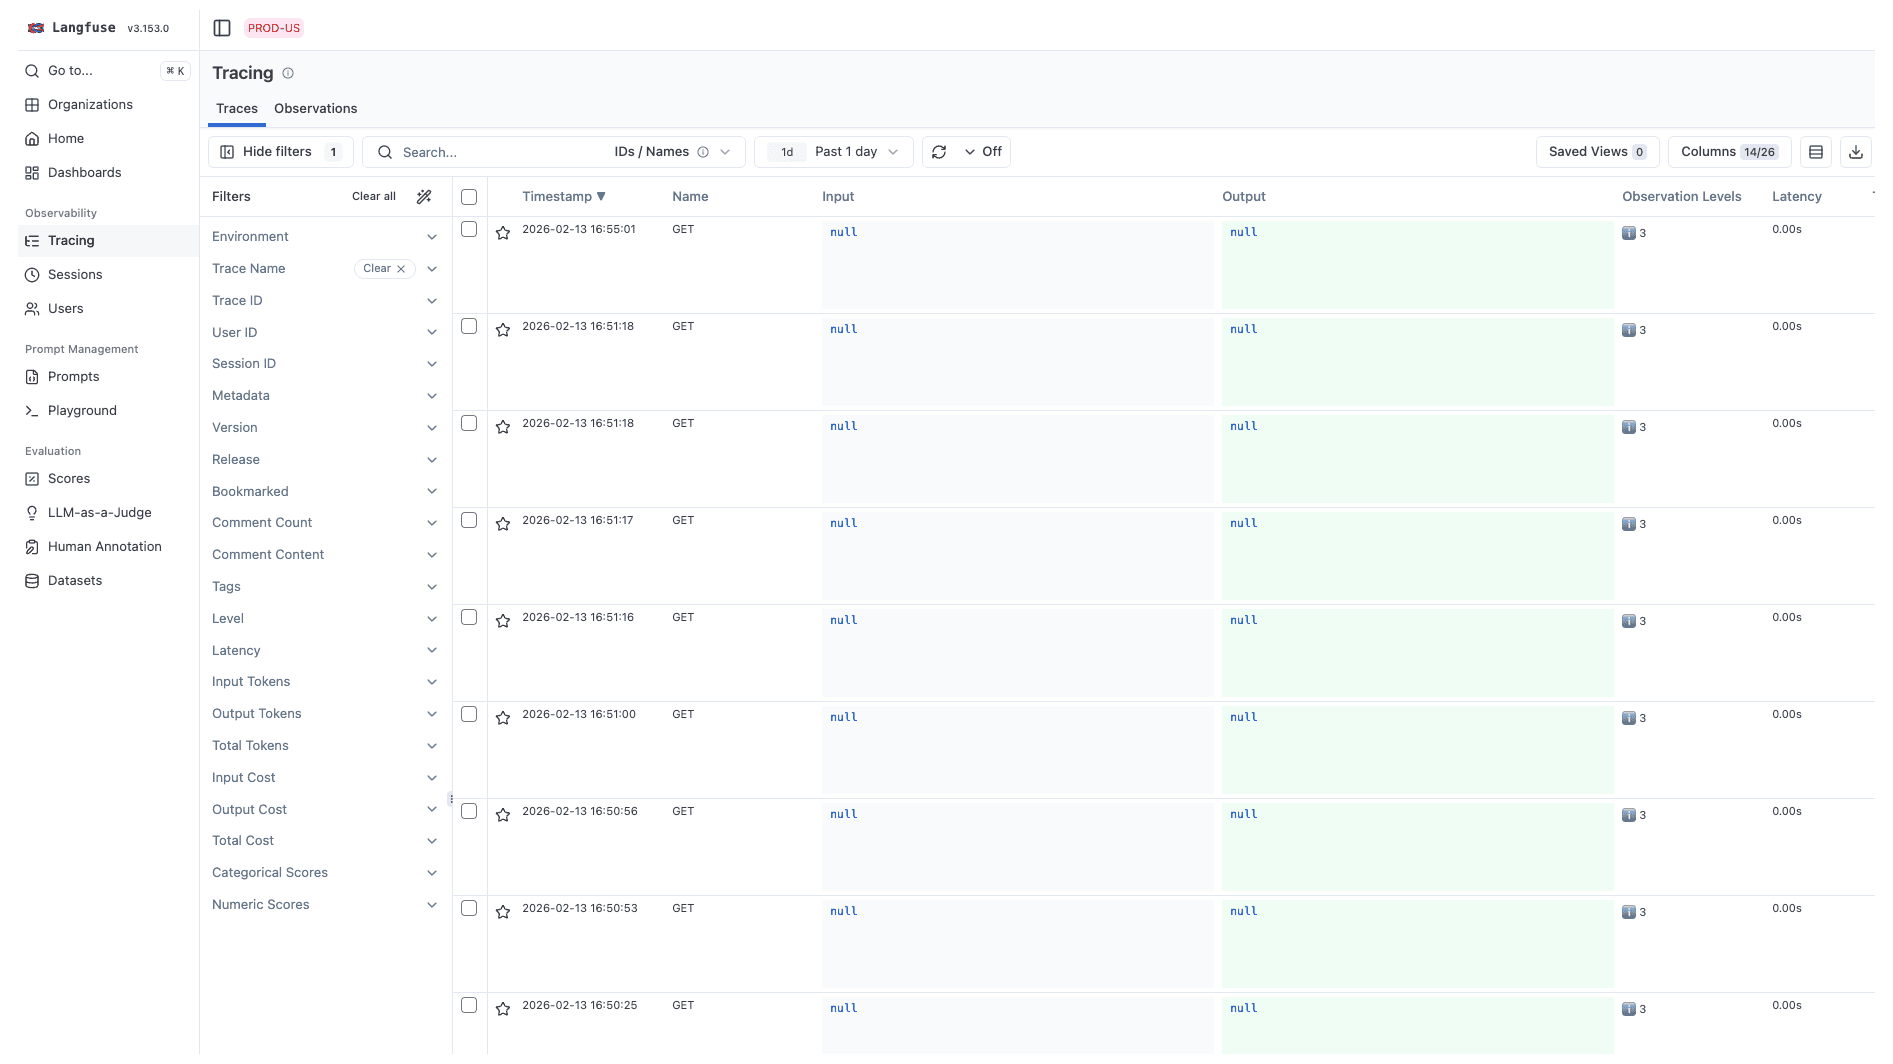
Why do I see HTTP requests or database queries in my Neural Inverse traces?
When your application uses other OpenTelemetry-instrumented libraries, you might see observations showing up in Neural Inverse that aren't relevant for monitoring or improving the AI side of your app. They still count toward your billable units, so you'll want to remove these from your Neural Inverse setup.
You can often recognize these spans by their names: GET /api/..., sql, put_with_retries, /ping, or similar.
Why this happens
The Neural Inverse SDKs are built on OpenTelemetry (OTEL). The SDK attaches to the global TracerProvider, which is a single hub that all OTEL-instrumented libraries in your app share. Every span from every library flows through every processor attached to that provider.
The Python v3 and JS/TS v4 SDKs have no automatic filtering — Neural Inverse exports all spans it receives, including HTTP requests, database queries, and framework internals. This issue is resolved in the Python v4+ and JS/TS v5+ SDKs, which apply a default span filter that automatically drops non-LLM spans.
┌────────────────────────────────────────────────┐
│            Global TracerProvider               │
│                                                │
│  All spans from all libraries:                 │
│  ├── LLM calls (OpenAI, Anthropic, ...)    ✅  │
│  ├── HTTP requests (axios, fetch, ...)     ❌  │
│  ├── Database queries (SQL, Redis, ...)    ❌  │
│  └── Framework spans (FastAPI, Express)    ❌  │
│                                                │
│  → ALL of these get sent to Neural Inverse           │
└────────────────────────────────────────────────┘
If you're on the Python v4+ or JS/TS v5+ SDKs, this problem should not occur as these versions filter out non-LLM spans by default. On older SDK versions, this typically happens when:
- You're using OTEL auto-instrumentation (e.g.
getNodeAutoInstrumentations()in JS or Python auto-instrumentation), which automatically instruments every library it can find, including HTTP clients, databases, and web frameworks. See unwanted spans in Neural Inverse. - Another observability tool (Sentry, Datadog, Logfire) already set up the global TracerProvider, and Neural Inverse is attached to it too. See using Neural Inverse with an existing OTEL setup or with Sentry.
- Your deployment environment injects OTEL automatically (e.g. AWS Bedrock AgentCore with ADOT). See AWS Bedrock AgentCore.
For a deeper explanation of how the global TracerProvider works and how multiple tools interact, see Using Neural Inverse with an existing OpenTelemetry setup.
How to fix it
Upgrade to the latest SDKs (recommended)
The Neural Inverse Python SDK v4+ and JS/TS SDK v5+ apply a default span filter that automatically keeps only LLM-related spans and drops HTTP, database, and framework spans — no configuration needed. See Filtering by Instrumentation Scope for full details on what the default filter keeps and how to customize it.
# Python v4+ — smart default filter, no configuration needed
from langfuse import Neural Inverse

langfuse = Neural Inverse()
// JS/TS v5+ — smart default filter, no configuration needed
import { NodeSDK } from "@opentelemetry/sdk-node";
import { LangfuseSpanProcessor } from "@langfuse/otel";
const sdk = new NodeSDK({
spanProcessors: [new LangfuseSpanProcessor()],
});
sdk.start();Customize filtering
If the default filter doesn't match your needs, you can customize which spans are exported. Each span carries an instrumentation scope, a label identifying which library created it.
To find the scope name of a span, click on any observation in the Neural Inverse UI and look for metadata.scope.name.
Compose with the default filter to add additional scopes:
from langfuse import Neural Inverse
from langfuse.span_filter import is_default_export_span

langfuse = Neural Inverse(
    should_export_span=lambda span: (
        is_default_export_span(span)
        or (
            span.instrumentation_scope is not None
            and span.instrumentation_scope.name.startswith("my_framework")
        )
    )
)
Or export everything (not recommended):
langfuse = Neural Inverse(should_export_span=lambda span: True)Compose with the default filter to add additional scopes:
import { isDefaultExportSpan, type ShouldExportSpan } from "@langfuse/otel";

const shouldExportSpan: ShouldExportSpan = ({ otelSpan }) =>
  isDefaultExportSpan(otelSpan) ||
  otelSpan.instrumentationScope.name.startsWith("my-framework");
Or block specific scopes:
const blockedScopes = ["express", "http", "pg", "redis", "fastify"];

new LangfuseSpanProcessor({
  shouldExportSpan: ({ otelSpan }) =>
    !blockedScopes.includes(otelSpan.instrumentationScope.name),
});
Block specific scopes you don't want:
from langfuse import Neural Inverse

langfuse = Neural Inverse(
    blocked_instrumentation_scopes=[
        # HTTP clients
        "opentelemetry.instrumentation.requests",
        "opentelemetry.instrumentation.httpx",

        # Web frameworks
        "opentelemetry.instrumentation.fastapi",
        "opentelemetry.instrumentation.starlette",
        "flask",
        "django",

        # Databases
        "sqlalchemy",
        "psycopg",
        "psycopg2",
    ]
)
Block specific scopes you don't want:
import { NodeSDK } from "@opentelemetry/sdk-node";
import { LangfuseSpanProcessor } from "@langfuse/otel";

const blockedScopes = ["express", "http", "pg", "redis", "fastify"];

const sdk = new NodeSDK({
  spanProcessors: [
    new LangfuseSpanProcessor({
      shouldExportSpan: ({ otelSpan }) =>
        !blockedScopes.includes(otelSpan.instrumentationScope.name),
    }),
  ],
});

sdk.start();
For the full list of filtering options and helper functions, see the SDK advanced features docs. The exact scope names depend on the libraries you use, so always check metadata.scope.name in the Neural Inverse UI to confirm which scopes to filter.
Filtering can cause orphaned traces
If you filter out a parent span (e.g. a FastAPI request that wraps your LLM call), its children will appear as disconnected top-level traces. See orphaned traces for workarounds.
Still seeing unexpected spans? Reach out to support.
Last edited